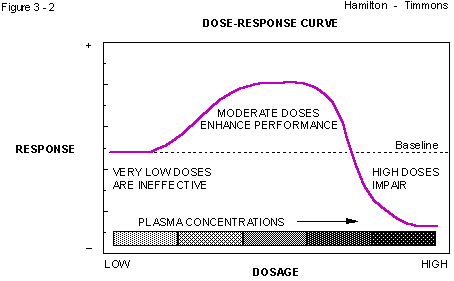
Dose-response curve shows that behavior changes as drug levels in the plasma change.