A SPECTROGRAM is a graphic image produced by a SPECTROGRAPH. Spectrographs can either be descrete machines or, can be computer software that accomplishes the same thing. A spectrograph analyzes the digitized sound coming into the computer and breaks it down into its consituent parts and then renders the result as a graphic on the screen. Because of the speed of today's computers, we enjoy this delay in virtual real-time (e.g., the result appears on the monitor only a few milleseconds after the sound is made).
When one hears a single note sung by a voice (or any other musical instrument),
one is actually hearing many simultaneous tones in addition to the one
we perceive as the pitch. This complex of tones, called HARMONICS,
can clearly be seen the following spectrogram.
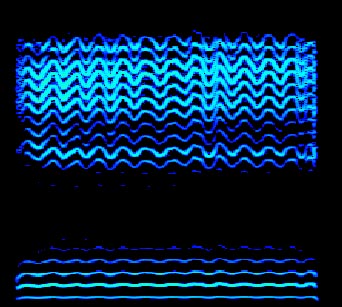
In this graphic, time is read on the x-axis and frequency (pitch) is read on the y-axis. The pitch we perceive is the result of the lowest tone on the spectrogram (the FUNDAMENTAL) and each higher line is a harmonic that occurs at ever higher pitches.
We can also ascertain the loudness of the various components of the sound by comparing the brightness of the colors of the harmonics in the display … the brighter the color, the louder the sound.
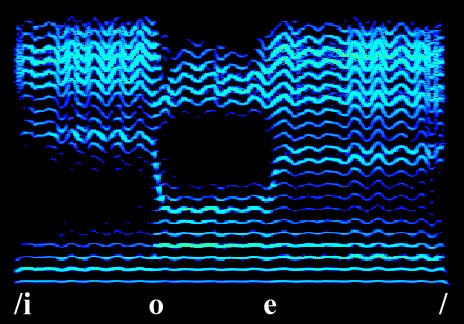
Notice that there some areas where several harmonics group together so they show up as louder than the rest. These areas of grouped harmonics are called FORMANTS. It is the location of these formants that reveal the identity of the vowel being produced. For example, the vowel shown in the previous spectrogram is /i/ (as in "sing"). Each vowel that we produce has its own unique pattern of formants. Look at the following graphic to see such differences.
It is amazing that our brains can perceive these subtle differences by “hearing” harmonics that are so soft that we cannot consciously hear them.
On the other side of the spectrum (pun intended), we find a class of sounds that we call noise.
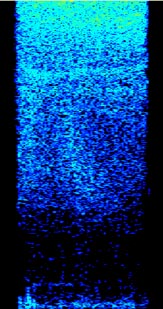
In this spectrogram we do not see the clear orderly system harmonics we saw earlier in the vowel examples. Now we see only chaos in this graphic of the consonant /s/. Without the mathematically determined harmonics, this sound is classified as a NOISE. Many language consonants are specific kinds of noises and each one appears uniquely different in a spectrogram.
But the usefulness of the spectrogram goes far beyond merely ascertaining the identity of PHONEMES (language sounds). The quality of the sound and many other attributes can be read from the spectrogram. In other links given on the main LAS3 menu, we will explore some of these uses in the voice studio.