Hwk 2 key

1. a. See graph above. The equilibrium price is $60 and the equilibrium quantity is 100.
b. Supply elasticity: Slope of S is 20/40 or ½. At the equilibrium the slope of the supply curve is (1/ ½)* (60/100) = 1.2
Slope of D is -1. Demand elasticity is -(1/1) * (60/100) = -.6
c. S is elastic, and D is inelastic at this point.
d. Qs=60, Qd=120. There is a shortage of 60 units.
e. The above graph depicts a price ceiling.
f. Because wool is an input, this change shifts the supply curve inward. If the price rises by $10, then the new price will be $70 and the new equilibrium quantity will be 90 (remember you move up the demand curve by $10 when you shift the S curve.)
g. The original TR (p*q) was (60*100) = 6000.
Now TR is (70*90) = 6300.
Since TR has risen, demand must be inelastic.
h. An unusually warm winter is likely to reduce the demand for sweaters, leading to a decrease in p and q.

i. The reduction in S causes a rise in p and a drop in q (from pt. a to b.) The reduction in D causes a drop in p and a drop in q (b to c). The net effect q drops, but change in p uncertain. See graph below
2. I.C (see notes for Ch. 4)
II. B
By definition a good that is more sensitive to price is more
elastic, and more elastic goods are those with many substitutes.
III. B
Income elasticity is %DQ/%DY and is negative for inferior goods.
-1/3 = %DQ/30%. Solving for %DQ, we find that Q = -10.
IV. D
When the price of a good falls, that leads to a rise in real income. A rise in real income leads to an increase in the quantity of normal goods, and a decrease in the quantity of inferior goods.
3.a. The graph should show that the price and quantity have increased over the ten year period.
b. This suggests that the demand for gas has increased (movement along the supply curve.)
c and d. The article provides an explanation of why our demand for gas has increased - changes in family structure, employment patterns, geographical location. Why public transportation is not always a good substitute for commuting (effects elasticity of demand for gas), how time constraints and opportunity cost affect our decisions about commuting/gas consumption.
4. a and b.
4. c 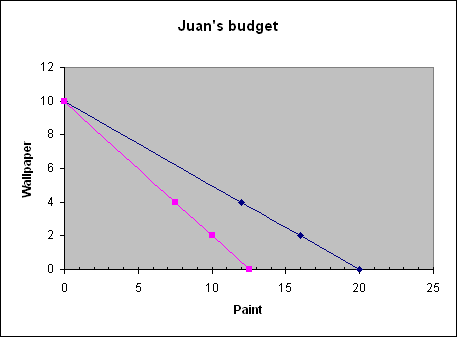
4. d
This question is a little bit complicated, since the budget constraint will no longer be continuous. If you are interested in the answer, come by my office. Note that you will not be responsible for this on the exam.
5. This question is also a bit tricky. First, you have to note that the article points out that there is a surplus of sugar in the US. What could have caused that? Answer: a price floor to protect farmers. So you need to draw a graph with a price floor. The article also points out that the government is paying farmers not to grow. So this means that there will be a reduction in the Supply curve, which will lessen the surplus.